

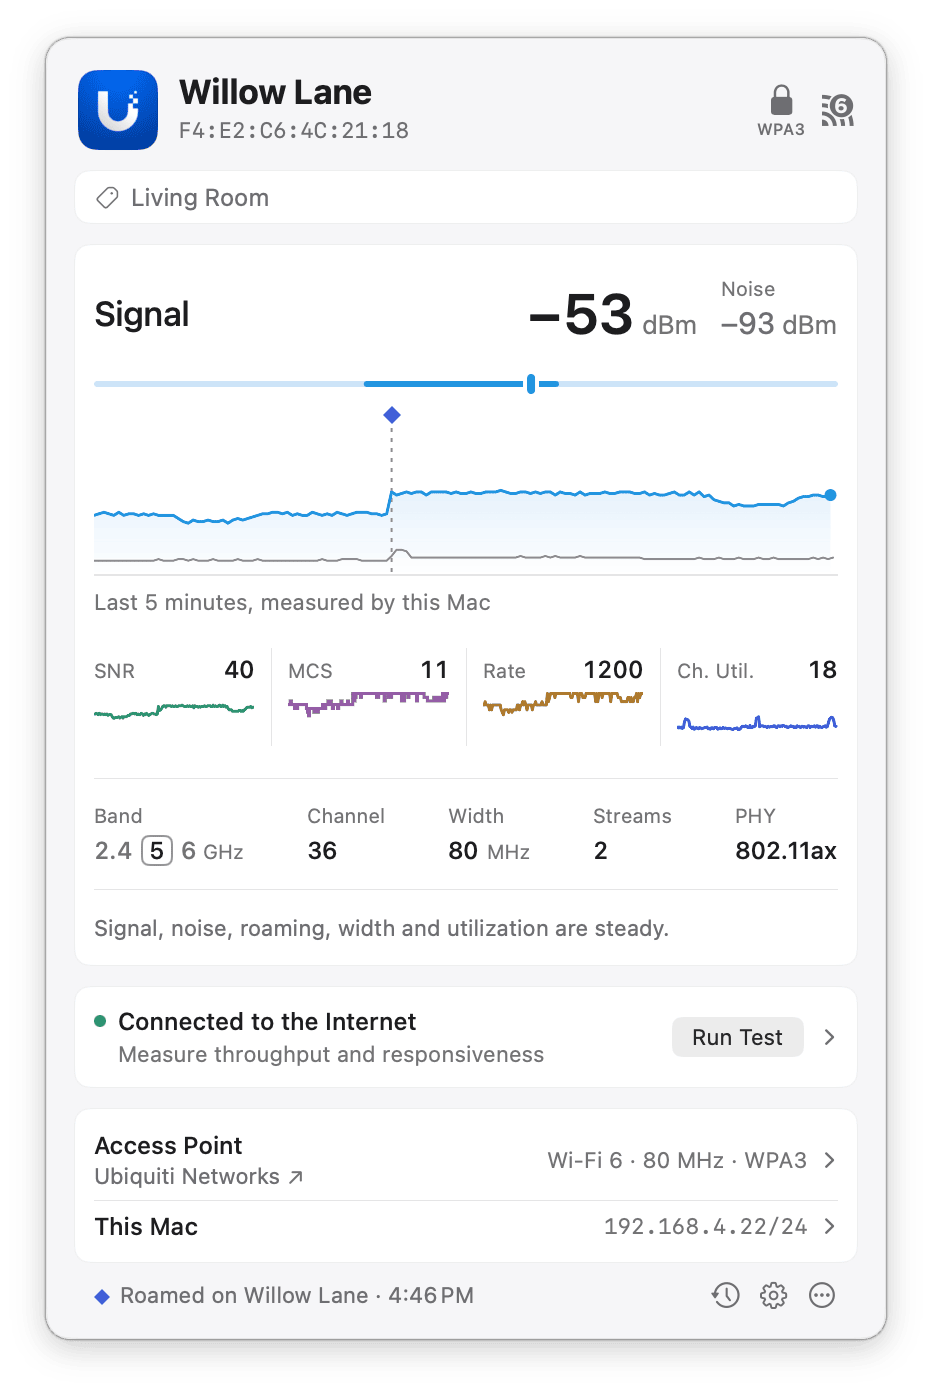
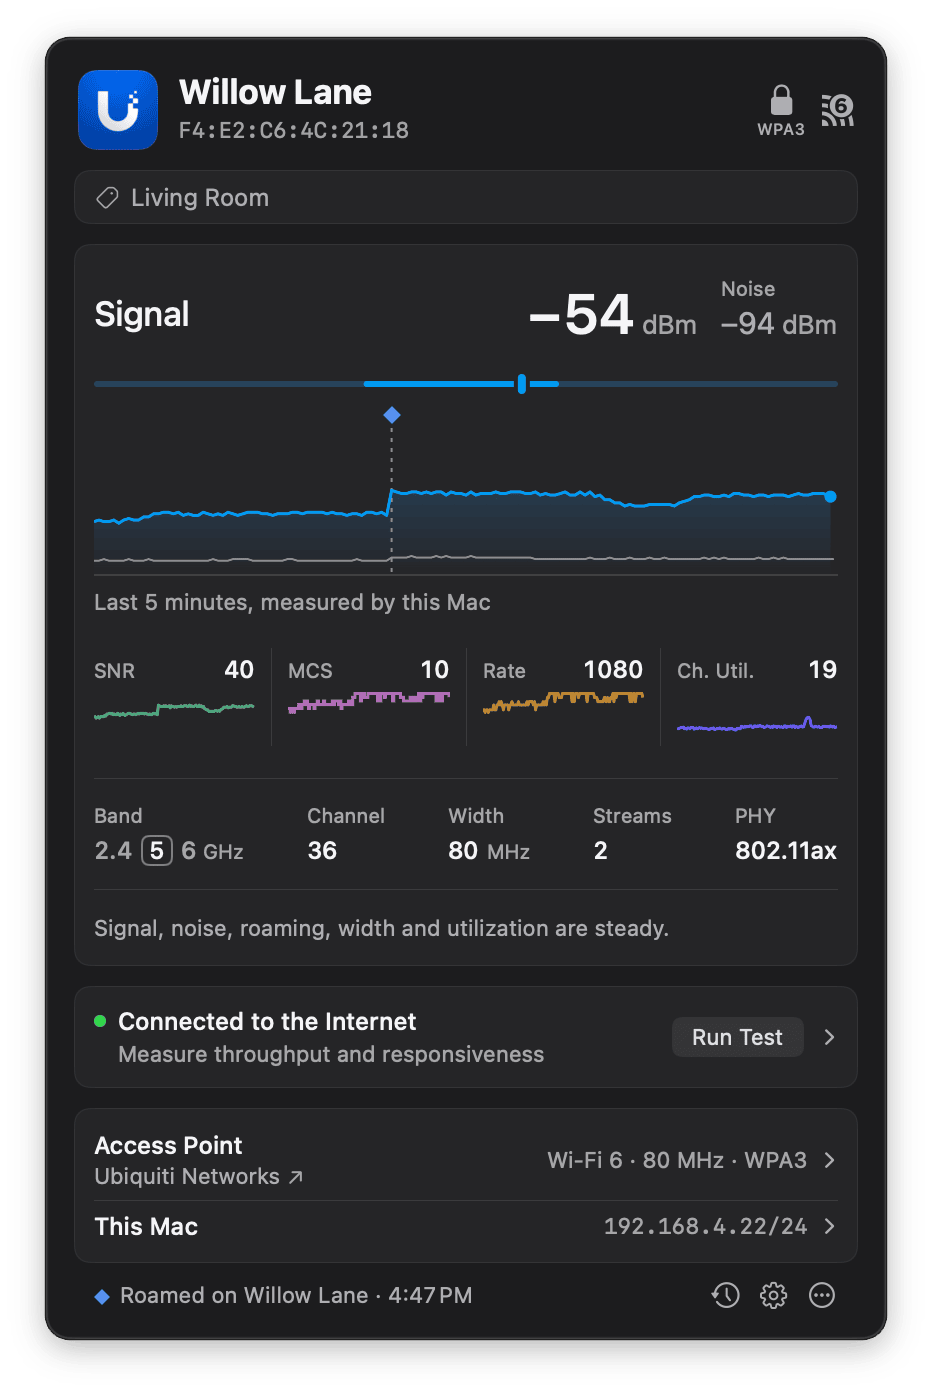
The Signal chart in the large plot, with a roam to a stronger access point marked on it.
Meter
The meter shows the chart in the large plot on its full scale. A bar covers the range of readings over the last five minutes, from the lowest to the highest, and a knob marks the current reading. A short bar means the reading held steady; a long one means it moved a lot. The meter uses the same scale as the plot under it: for MCS Index and Transmit Rate, the scale runs to the most this connection can reach. Move the pointer over the meter to see the lowest, current, and highest readings, for example “Min: 12% · Current: 23% · Max: 37%”. For signal quality, look at the Signal-to-Noise Ratio chart rather than signal strength alone. A strong signal on a noisy channel can perform worse than a weaker signal on a quiet one. If your connection is slow or unstable, check that SNR stays above 25 dB. See Wi-Fi troubleshooting basics for what to check if it doesn’t.Live charts
The popover shows one large chart and a row of smaller charts under it. Each chart covers the last five minutes.
To show a different chart in the large plot, click it in the row of smaller charts. WiFi Signal Pro remembers your choice.
To see the reading at a particular moment, move the pointer over the large chart. The reading at the top of the popover, the meter’s knob, and the readings on the smaller charts follow the hovered moment, and its time appears above the chart using your Mac’s 12- or 24-hour clock setting. Stretches with no readings, such as when your Mac was asleep, are hatched and labeled. If your Mac woke briefly while asleep with the lid closed, the chart shows the whole time as asleep.
Roams
When your Mac moves to another access point (BSSID) on the same network, WiFi Signal Pro marks the roam on the large chart. Move the pointer over the mark to see which access point your Mac roamed to and how much the signal strength changed. For a few seconds after a roam, macOS doesn’t report a transmit rate, and sometimes not the noise either. The Signal chart continues through the roam, but the Signal-to-Noise Ratio, MCS Index and Transmit Rate charts can show a short break.Link rates
Under the charts, the popover shows the current channel, channel width, number of spatial streams, and PHY mode. The Wi-Fi generation appears as a badge beside the security mode at the top of the popover. When the MCS Index or Transmit Rate chart is in the large plot, the note at the right under the plot gives the highest index your Mac uses for this connection, for example “Up to MCS 11”, or the highest rate this connection can reach as it stands, given its generation, band, channel width, and spatial streams, for example “Up to 1200 Mbps”. A reading well below that maximum can point to interference or distance from the access point. The channel width and spatial streams show when the connection is using less than your Mac and the access point support.The transmit rate is not your connection speed. It’s the rate at which data is sent over the air, and it doesn’t account for protocol overhead, acknowledgments, contention with other devices on the channel, or retransmissions. The throughput you get, for example in a speed test, is typically well below the transmit rate.
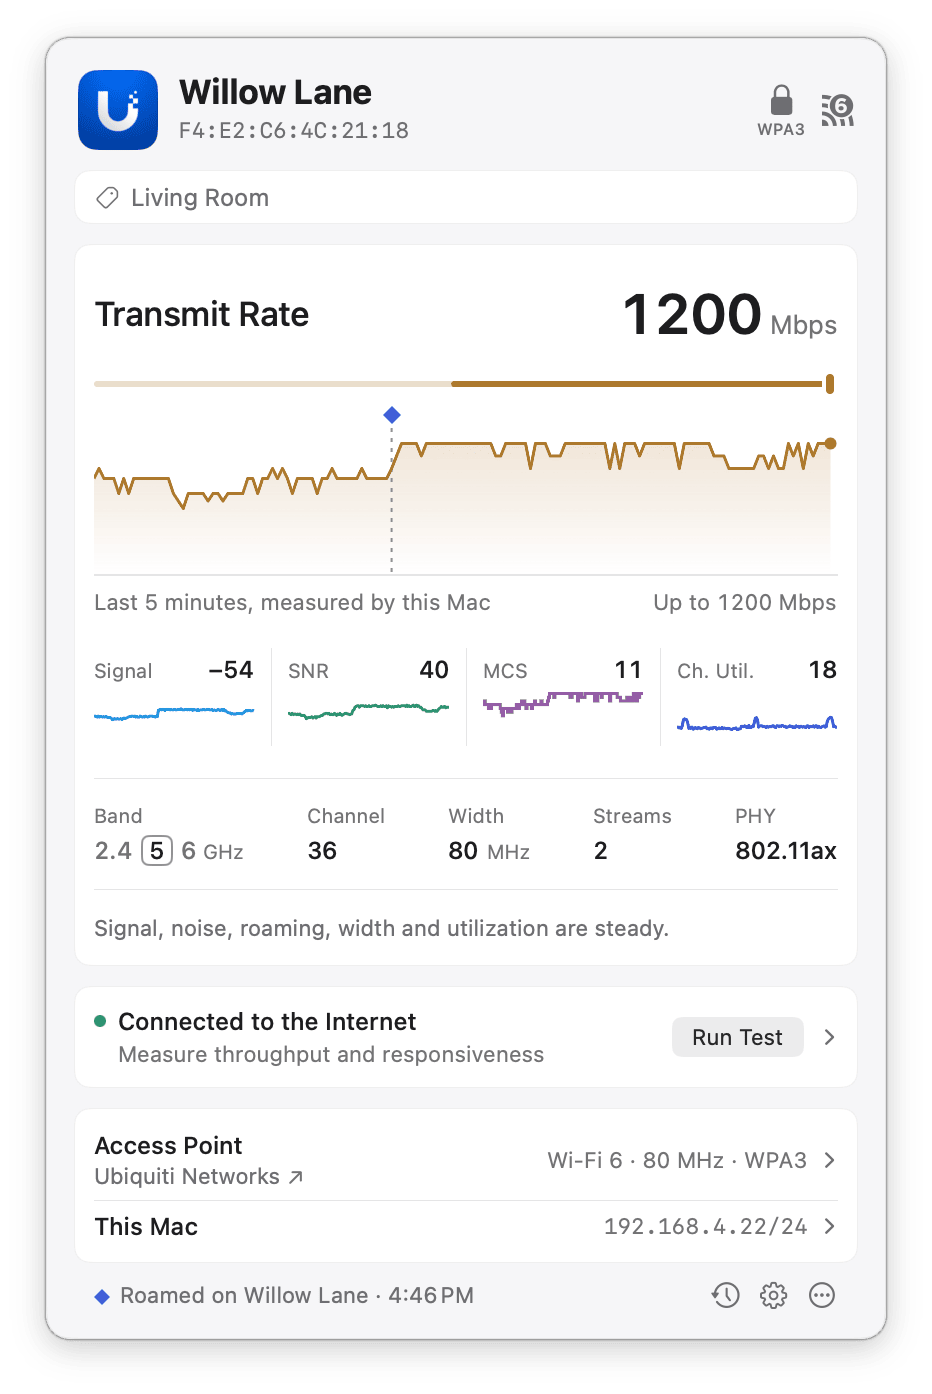
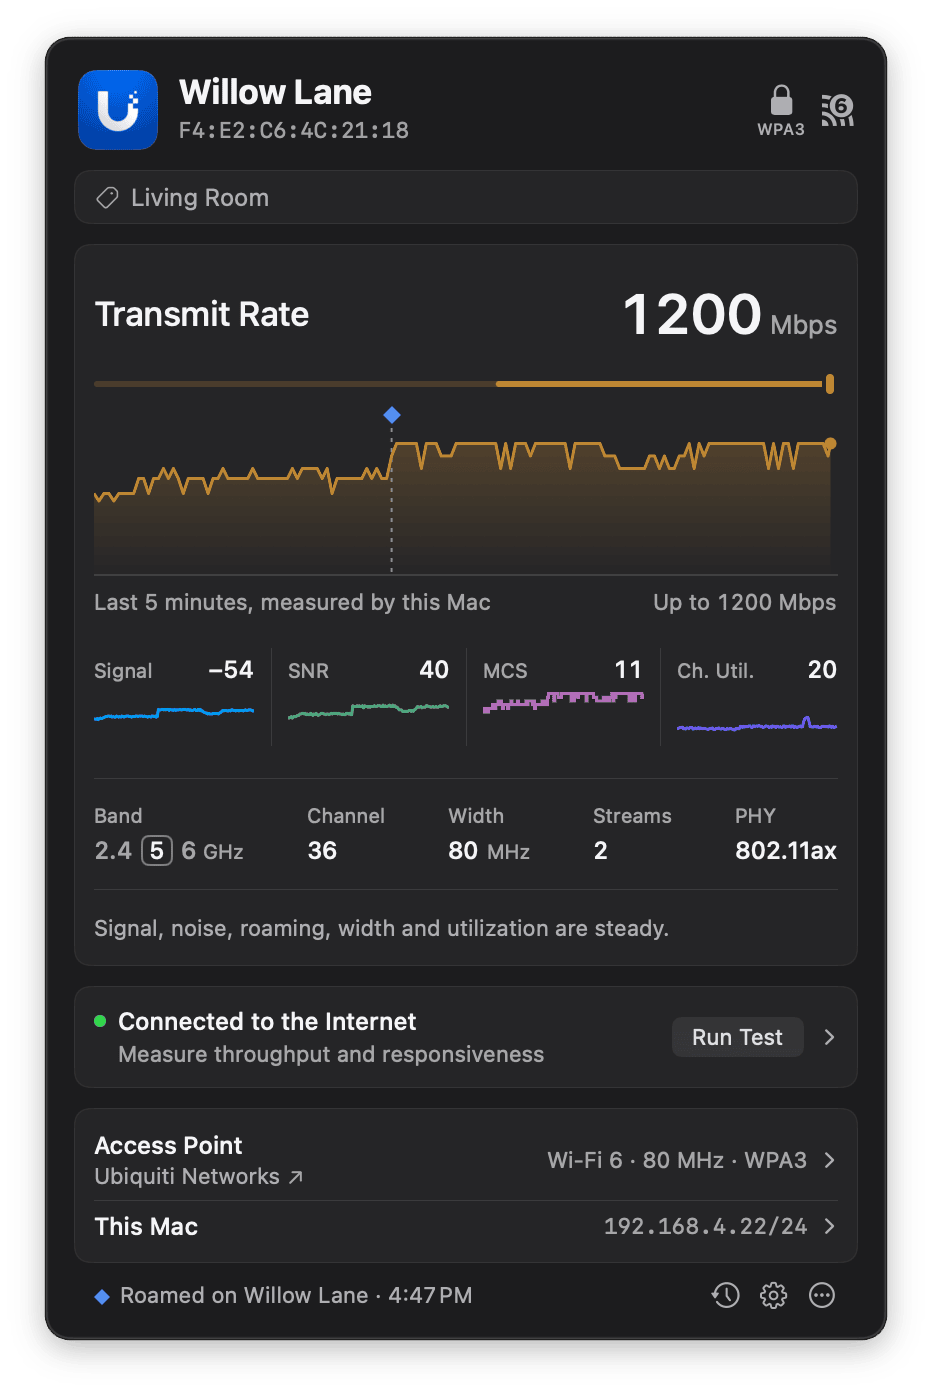
The Transmit Rate chart in the large plot, with the highest rate this connection can reach.